Here we present a model of diatom shapes based on principal curves. Each principal curve models the growth trajectory of a diatom species. Our model is suitable for reconstruction purposes, allowing us to produce the drawings of diatom life cycle related shape changes, thus providing a link between the photographs and drawings. We use our model for the classification (= identification) of photographed and drawn specimens, and our results are comparable to other diatom identification systems (see the ADIAC project). Finally, given an unknown diatom specimen we are able not only to identify the species it belongs to but also to pinpoint the stage in the life cycle it represents.
First, we extract diatom contours from digital photographs using a succession of automatic thresholding, area closing and area filling operations. Then we represent the extracted contours using Fourier descriptors. Before representing the extracted contours we resample them to the same length in order to obtain the same number of Fourier descriptors for each contour.
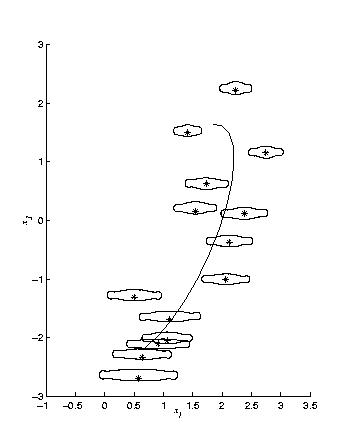
Prior to modelling the diatom shape data we find main modes of variation in the data set of all species through PCA. We model the life cycle variation in a single species using a principal curve through the middle of the corresponding data set created by the Fourier descriptor vectors projected into the eigenspace. For illustrative purposes we modelled the shape variation of Fragilariforma bicapitata. In the figure below you can see the original dataset projected into the space of the first and third eigenvectors with overlaid correponding diatom contours, as well as the principal curve fitted into the data. The fitted principal curve follows the growth trajectory of Fragilariforma bicapitata, which provides the main source of shape variation. Individual shape variations lie in the dimensions orthogonal to the principal curve.
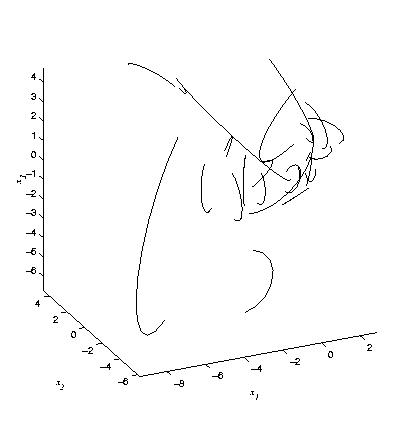
To classify specimens from a range of species, we fit an individual principal curve into each of the available species' shape data . The fitted principal curves can be viewed as a drastically reduced dimensional description of the life cycle variation across species. See the graph of principal curves projected into the space of the first three eigenvectors below (22 species shown here, images from ADIAC project).
This model can be used for the classification (= identification) of unknown specimens
through finding their distance from each of the principal curves and
then assigning them to the closest one.
We tested the model in identification experiments using the
standard "leave one out" approach, by training the model on all
specimens except one and classifying (=identifying) that specimen using the
model. The experiment was repeated to omit each specimen out of the
total 268 in turn. Approximately 84% were classified correctly, compared to 77%
achieved in the ADIAC project (see above) when using only Fourier descriptors for
identification. However, we used only a third of the dataset used in the
ADIAC project, so firm conclusions cannot be made yet.
Next, we tested how our
model performs when identifying drawings of diatoms. We tested the
model on 11 drawings of the species included in the model. The model
correctly identified 7 out of the 11 drawings, which is comparable to
identification results on the photographs. We expect the
identification accuracy to improve for both photographs and drawings
in the future when we include internal feature descriptors into the
model.
As mentioned above, given a photograph (or a drawing) of a
diatom specimen we can not only identify the species it belongs to but also
pinpoint the stage of the life cycle it represents. To illustrate
this, we projected the vectors representing the shape of
Fragilariforma bicapitata specimens onto the corresponding
principal curve and then sorted them in the order of their principal
curve projection points. The results were very close to the expected
order, as you can see below.
Finally, we reconstructed diatom contours from the knots on the principal curve representing Fragilariforma bicapitata species. You can see the reconstructed drawings in the order of the knots on the curve in the figure below. All the contours are scaled to the same length, however, if we incorporate the diatom length into the model, they can be scaled to the correct length.
You can find more details on the method described above in the article:
Hicks Y., Marshall D., Martin R.R., Rosin P.L., Bayer M.M. & Mann D.G. (2002).
Modelling life cycle related and individual shape variation in biological specimens. Proceedings
of the 2002 British Machine Vision Conference (BMVC2002), September 2-5, 2002, Cardiff, UK. Vol. 1,
323–332. ISBN 1 901725 19 7 (Proceedings); ISBN 1 901725 20 0 (CDROM).
Back to results page
Back to top of page